Sunday, March 17, 2013

Assignment 7: Navigation with GPS

Introduction

This week was a continuation of the past several weeks. The class went back out to the Priory to do more navigation exercises. This time around however we were to use a GPS to navigate to our points. We also will not be added by a map. Everyone was assigned a new course to complete. This time my team did course two backward. Every student was issued a Garmin GPS unit. These units served a duel purpose. They were to help us find the points and the other was to record a track log for each student. When we got back to the lab we would use the track logs to create three different maps, a map with just our track log, one with our whole team and one with everyone's track log. The Eau Claire area had just experienced a snow storm earlier that day. There was still some snow flurries when we started out.

Methods

The class met up at the parking lot at the Priory. We were issued a Garmin GPS unit and taught how to record a track log. A track log takes continuous point data that can be used to show a persons path that they took. We were also given the coordinates of a new course. This time my team did course two in reverse. Point 1 is the starting point. From there we went from points 6-2 and then back to 1. We did not have our entire group with us this time. Drew came late after me and Stacy had started the course. Drew caught up with Team 1 and so did the course from 2-6 instead of 6-2. This means his track log will look different from ours so that the team map will look odd.

The Garmin GPS uses UTM eastings and northings to show where on earth a person is. Figure 1 shows a picture of our GPS with it showing the UTM coordinates and a compass. It took me and Stacy a little while to get used to navigating with the GPS units. We ended up going in the wrong direction for a while before we got on the right track. It was a little difficult to figure out in what direction we had to walk in to get the numbers to do what we wanted. At the end of the course we stopped our track logs to complete our paths. We would download the information later back at the lab.

Figure 1: This is our Garmin etrex that we used for this activity. The UTM coordinates are shown at the top of the screen.


In the lab we downloaded the track logs using the DNR Garmin software. We made a point feature class of our track log and put it in a class geodatabase. This way we all had access to each others data to make our maps. We made point features because you can do better analysis using points then with lines. For example you can map out the time field and color the points to show in which direction a person walked. This is what I did in Figure 2. Figure 2 shows a map of my individual track log. The points go from green to yellow to red depicting where I walked when.  Looking at the map you can see it took me and Stacy a little bit to get used to the GPS units. From point 1 to point 6 we started out going in the wrong direction in the beginning. What the map does not show is that we headed down a really steep hill before we figured out we where going in the wrong direction. So it turned out we had to climb back up the hill we just went down.  From point 5 to point 4 we had to navigate around a pond so we could not go in a straight line but had to take a detour.
Figure 2:  A map of my individual track log.
The next map we had to make was a map of our team. Figure 3 shows our team map. Stacy and my tracks line up pretty well. Drew's on the other hand does not. This is because he showed up late and we had already started the course. Drew ended up doing the course with Team 1 who was on course 2 as well. They however were doing the course forward. So Drew's track is going in the opposite direction then ours.
Figure 3: Our team map.
The last map we were to make was one of every students track log. Figure 4 shows a map of every team withe the courses we each did. This time I did not map out the the time attribute of the track logs. Instead to show the different teams I made the points one color so to distinguish the different teams. All the odd numbered teams did their course forward while the even teams went backwards.

Figure 4: A map of every student. The students track logs are color coded depending on which team they were on.


Discussion

I found this activity much easier then using the map and compass. It certainly went a lot faster then the last time when we used the map. When using the map and compass you need to be in a group of a bare minimum of 2 or 3. It is important to have a person to count the paces, one to go ahead of the group and one to hold to compass and instruct the person out front to line up with the azimuth reading. Before heading out you need to plot the points on a map, get the azimuth between the points and the distance between the points. With the GPS units a person could navigate by themselves. All they would need was the coordinates of where they wanted to go. There really is now preparation to do before heading out like there is with the map and compass.

Like I mentioned in the introduction Eau Claire had just got dumped on by a snow storm. We had around 6in of new snow on the ground added to what was already on the ground. For most of the course me and Stacy were walking in snow all the way up to our knees. In some parts of the courses we were walking on the sides of ridges that were very steep and slippery. Me and Stacy ended falling in several places along those ridges. To get to point 5 we had to walk through a large stand of pine trees. These were much easier to walk through because the pine branches caught a lot of the snow, meaning less accumulated on the ground. Figure5-6 show how the deep the snow.

Figure 5: Stacy standing in the snow checking our coordinate

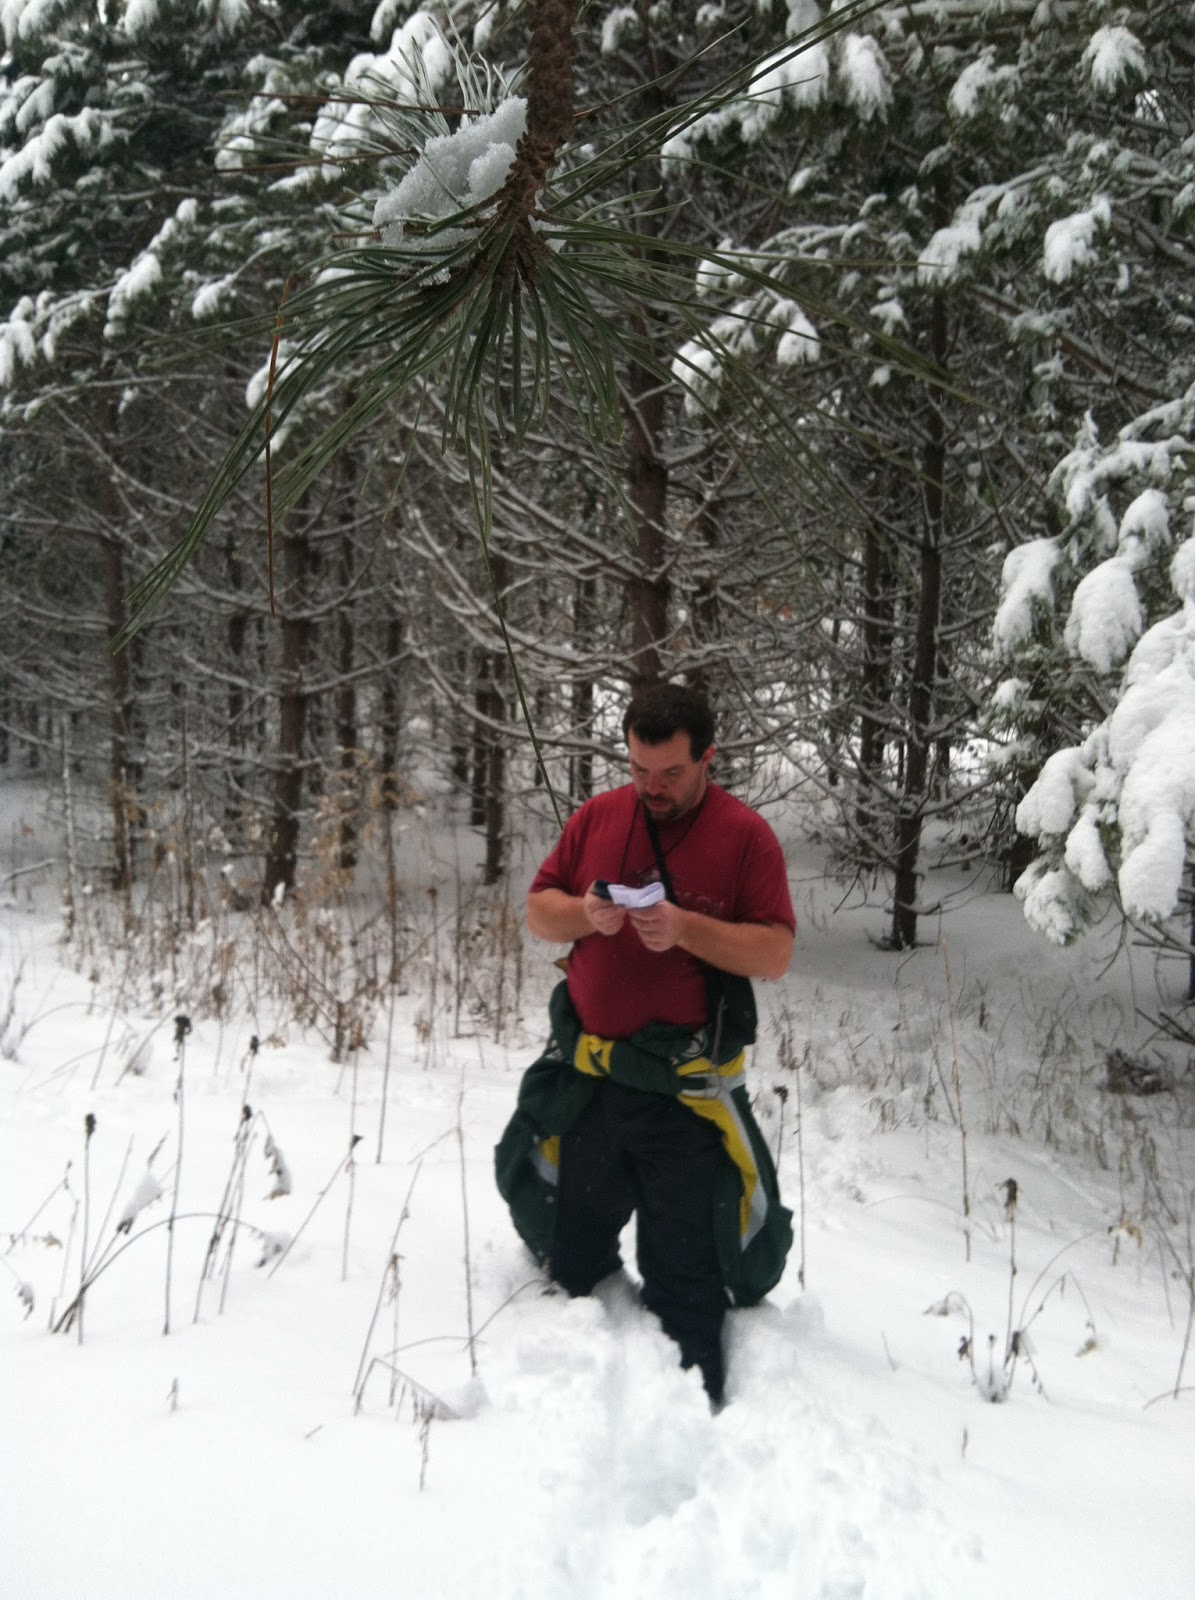
Figure 6: Me standing out in the snow. This was taken in the stand of pine trees. Here we tried to stay under the pines as much as possible because the snow was not as deep as other places like up above.

Results

This week's activity and last week's was to show us difference between traditional navigation(map and compass) vs. GPS navigation.  I believe that it did a very good job of showing the strengths and weaknesses of each method. While the GPS made it easier and faster to navigate, there could be a point when the GPS could not hook up with the satellites.  The traditional navigation does not relay on technology. It can be done anywhere, anytime, in any weather. The downside is that it takes longer to prepare, need to be in group of 2-3 and takes longer than the GPS navigation. Both methods a perfectly viable just depends on the situation you find yourself in when deciding which one to use.


.

Sunday, March 10, 2013

Assignment 6: Navigation with Map and Compass

Introduction

This exercise is the implementation of accumulation of skills we have learned in the past few weeks. We are going out the Priory to locate 5 points out in the woods. There were 3 different courses set up. Two teams would be on a course. One team would be going in one direction and the other in the other direction. All of the courses overlapped each other. This was done because there was snow on the ground and we could have followed tracks of the same team on our course to find the point instead of following the compass. With the courses interwoven together, we would have no idea if the tracks led to our points or anther courses points. The weather was overcast. There was snow flurries on and off while we were out there. We  used a map we made last week to plot points that were given to us. Once the points were plotted we then measure the azimuth from point to point so we can navigate once we are out in the field. At each point there was a flag with a hole puncher so we can punch our score card proving that we were at that point.

Methods

Upon arriving at the Priory we went into the building to meet up with our team. Inside we were given points in UTM coordinates. Figure 1 shows our points that we were to find. My team would be doing course 1 backwards. We would not be actually finding point 1 as part of the navigation exercise. Point 1 was used as a starting point. We were then to find points 6-2, in that order.

Figure1: These are the points that we were to find. We used our map to plot the UTM coordinates
We used the map we made last week to plot the points. This map had a grid over the map that was in UTM. I plotted the points and had Stacy and Drew double check my work. Figure 2 shows Stacy and Drew making sure the points were plotted correctly.  Once we were sure that we had our points plotted as accurate as we could get them, we then used a compass to get the azimuth for each point. We measured the azimuth from point 1 to point 6 and so on and so on. We would use these measurements to find our way in the field. Before leaving, we also measured out the distance between the points. We used the scale that was included on our maps and a sheet of paper so we had rough idea of how far we need to travel to find the point. Figure 3 shows us measuring out the azimuth for the points. Figure 4 is a table of our azimuth measurements. When taking the azimuth we did not need to worry about the declination because here in Eau Claire we are basically at zero.

Figure 2: Stacy and Drew checking the plotting of our points

Figure 3: Stacy is measuring out the azimuth using a compass and the map. Drew is recording the measurement
Figure 4: A table of our azimuth and distance to each point

Once we had our map done and had gotten all of our measurements, we went to outside to start the course.  Each person on our team had a specific role to play. Stacy was in charge of the compass. It was his job to make sure we stayed on course with our azimuth reading. Drew was our pacer. Last week we all paced out 100m so we could get our pace count. It was Drew's job to count his paces so we knew how far we had roughly went. My job was to go out in front of the group and stand in a spot on in line with our azimuth so it was possible to stay on course. I would work with Stacy so that we could stay on course. Once I went out a certain distance Drew and Stacy would catch up, Drew counting his steps, and we would start the process over till we found our point. Figure 5 shows me and Drew at the light post that was our starting point.

Figure 5: Me and Drew are all set to start the course.
Once out on the course we quickly figured out that the snow would become a problem. Drew had to adjust his pace count because he took it on a flat surface and he was now walking out in a forest that was covered in snow. We were also having to maneuver through trees both standing and those that had fallen. I could only go so far ahead of the other two because of visibility problems. Figure 6 shows Stacy taking a azimuth reading so we knew which direction to walk in. Figure 7  shows Drew counting out his paces. I am standing at the tree to mark where the path is.  At each point there was a flag and a hole puncher. Each team had a score card that they had to punch to prove that they had been to each point. Figure 8 shows the flag and punch card. Due to time constraints we only made it half way through the course. It took us a long time to get to from point 5 to point 4.

Figure 6: Stacy is using the compass to take an azimuth reading so we knew which direction to travel.
Figure 7: Drew is counting out his paces and I am standing behind a tree marking where he has to walk to

Figure 8: This is one of the flags we had to find. I am punching our card proving that we did indeed get to point 4.


Discussion

We were out on the course for about an hour and a half. Due to time constraints and the fact it was getting dark we only finished half of the course. We located points 6-4. It took us a very long time to get from point 5 to point 4. We were walking through the woods in winter. Which means in Wisconsin there is snow on the ground. The snow could have been as high as a couple of inches in some spots. In others we were walking through a couple of feet. To make matters more interesting the course was set up in such a way that we had to go up and down several hills to get to the points. The snow also caused issues because it hid fallen tree branches and some times whole trees. You did not walk down those hills, it was more like you slid down them. Figure 9 shows one of the hills we had to navigate. If you look up near the top of the picture in the middle, you can see Drew and Stacy coming down the hill.

Figure 9: This picture shows some of the terrain we had to walk through during the course. Stacy and Drew are at the top of the hill coming down to where I am near the bottom.
Due to visibility problems I could only go so far before having to stop and wait for the other two to catch up. These visibility problems were caused by the hilly terrain and the forest itself. Figure 10 shows an example of the low visibility that we had. A lot of the time I could not see Stacy and Drew and they had to shout to me which direction to move in so that i could stay in line with our azimuth reading. We also resorted to hand signals to communicate.

Figure 10: Stacy and Drew are catching up with me. In the woods could not see very clearly very far.

Conclusion

This was a very good exercise. It showed us how to navigate using no technology. All we were allowed to use was a compass and a map. Using the azimuth readings we took and keeping track on how far we had traveled we were able to locate 3 out of 5 points. Given more time I am confident that our team would have found the remaining two points. Next week we will be using GPS units and no maps or compasses to locate a new set of points.


Sunday, March 3, 2013

Assignment 5: Development of a Field Navigation Map

Introduction

This exercise is a set up for a navigation activity we will be doing in the upcoming weeks. Will be going out into the field to explore different ways to navigate to points. We will first be using a low tech method, using our strides, a map and a compass to navigate to five different points. The next week we will use a GPS to navigate to the points. That time we will not have a map to use as a reference. Today we will be making our map for of our study area.

Methods

Before making our map, the class first went out side to get our pace count. We each walked 100m several times while counting our steps. This way we were able to see how many our steps equaled 100m. My step count is 63.

After establishing our count, the class went inside to create a map we would use for our navigation course. We were split into teams of three but each student was tasked of making their own map. The team would then choose the best map to use. Our teacher provided us with data to use in the creation of our maps. We were to make a map with a grid on it. This grid was important part because each team would be given lat/long coordinates of our points, which we then would have to find.

Below are the two finished maps that I created. Figure1 shows an aerial photo with a grid overlaying it. The red lines are five foot contours. The contour lines are useful in determining the topology of the land. Figure 2 shows two maps made into one. The one of the left is a smaller version of Figure 1. The one on the right is a slope shading with the five foot contours on top. Each of the maps are at the same scale for acute comparison.
Figure 1: This one of the maps that I made.
Figure 2: The map on the left is an aerial with a grid. The second shows the slop of the land with contour lines to add more detail.